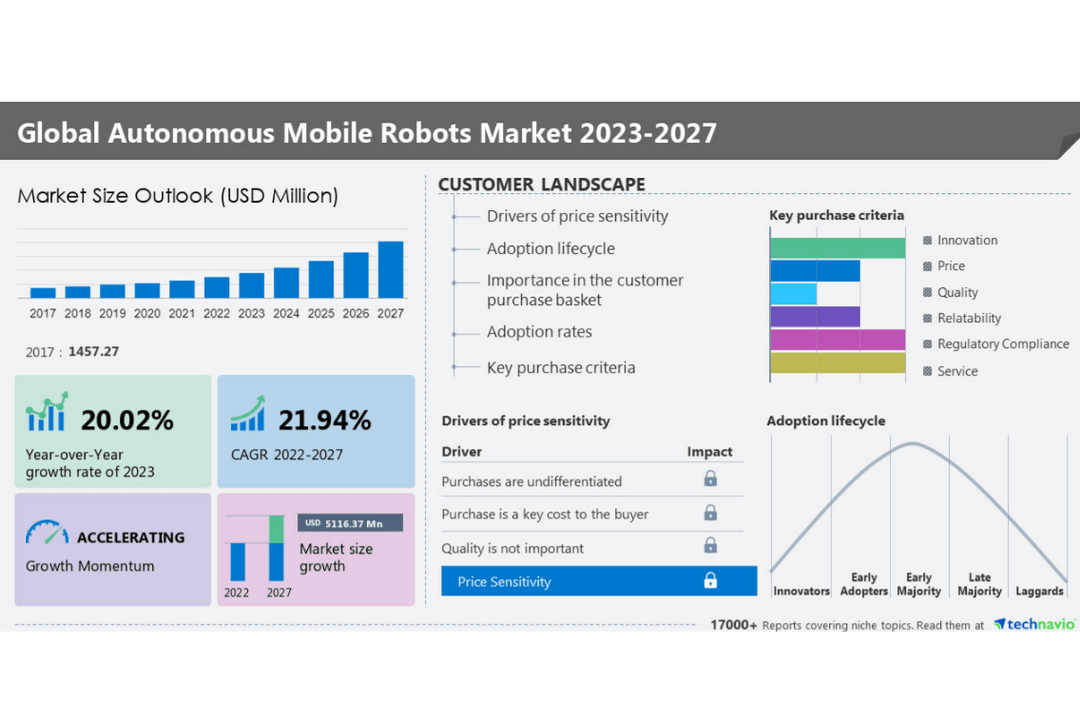
NEW YORK – The autonomous mobile robots market size is forecast to increase by USD 5,116.37 million from 2022 to 2027, at a CAGR of 21.94%, according to the recent market study by Technavio. The report includes historic market data from 2017 to 2021. In 2017, the market was valued at USD 1,457.27 million. The growth of the market will be driven by the good ROI offered by autonomous mobile robots, miniaturization of sensors, and increasing offshore exploration and production (E&P) programs. Charts & data tables about market and segment sizes for a historic period of five (2017-2021) years have been covered in this report.
Technavio has extensively analyzed 15 major vendors, including ABB Ltd., Align Production Systems, HAHN Group GmbH, IAM Robotics, JASCI LLC, Koerber AG, L3Harris Technologies Inc., Lockheed Martin Corp., MIDEA Group, OMRON Corp., Robotnik Automation SLL, SESTO ROBOTICS Pte. Ltd., Stanley Robotics, Teradyne Inc., Thales, The Boeing Co., Vecna Robotics Inc., Zebra Technologies Corp., QinetiQ Ltd., and Toyota Motor Corp.
Key Benefits for Industry Players & Stakeholders –
- The report offers information on the criticality of vendor inputs, including R&D, CAPEX, and technology.
- It also provides detailed analyses of the market’s competitive landscape and vendors’ product offerings.
- The report also provides a qualitative and quantitative analysis of vendors to help clients understand the wider business environment as well as the strengths and weaknesses of key market players. Data is qualitatively analyzed to categorize vendors as pure play, category-focused, industry-focused, and diversified; it is quantitatively analyzed to categorize vendors as dominant, leading, strong, tentative, and weak.
Expand operations in the future – To get requisite details, ask for a custom report.
Customer Landscape – Analysis of Price Sensitivity, Adoption Lifecycle, Customer Purchase Basket, Adoption Rates, and Purchase Criteria by Technavio
- One of the core components of the customer landscape is price sensitivity, an analysis of which will help companies refine marketing strategies to gain a competitive advantage.
- Another key aspect is price sensitivity drivers (purchases are undifferentiated, the purchase is a key cost to buyers, and quality is not important), which range between LOW and HIGH.
- Furthermore, market adoption rates for all regions have been covered.
Get a holistic overview of the endoscopic closure devices market from industry experts to evaluate and develop growth strategies.
The market is segmented by end-user (aerospace and defense, oil and gas, logistics transportation and manufacturing, agriculture and mining, and others), component (hardware, software, and services), and geography (North America, Europe, APAC, Middle East and Africa, and South America).
Segmentation by End-user (Inclusion/Exclusion)
- The aerospace and defense industry is the key end-user in the market. The segment is primarily driven by increased defense budgets by countries across the world. Technological innovations such as the incorporation of infrared sensors for use at nighttime by vendors are also driving the growth of the segment.
Register for a free trial today and gain instant access to 17,000+ market research reports.
Technavio’s SUBSCRIPTION platform
What are the key data covered in this autonomous mobile robots market report?
- CAGR of the market during the forecast period
- Detailed information on factors that will drive the growth of the autonomous mobile robots market between 2023 and 2027
- Precise estimation of the size of the autonomous mobile robots market size and its contribution to the market in focus on the parent market
- Accurate predictions about upcoming trends and changes in consumer behavior
- Growth of the autonomous mobile robots market industry across North America, Europe, APAC, Middle East and Africa, and South America
- A thorough analysis of the market’s competitive landscape and detailed information about vendors
- Comprehensive analysis of factors that will challenge the growth of autonomous mobile robots market vendors
Related Reports:
- The smart robots market is estimated to grow at a CAGR of 19.5% between 2022 and 2027. The size of the market is forecast to increase by USD 13,222.51 million. Technological advances in smart robots are notably driving market growth, although factors such as the high cost of smart robots may impede the market growth.
- The smart machines market is estimated to grow at a CAGR of 18.7% between 2022 and 2027. The size of the market is forecast to increase by USD 25.41 billion. The miniaturization of sensors is notably driving the market growth, although factors such as the high cost of deployment may impede the market growth.
| Autonomous Mobile Robots Market Scope | |
| Report Coverage | Details |
| Page number | 177 |
| Base year | 2022 |
| Historic period | 2017-2021 |
| Forecast period | 2023-2027 |
| Growth momentum & CAGR | Accelerate at a CAGR of 21.94% |
| Market growth 2023-2027 | USD 5116.37 million |
| Market structure | Fragmented |
| YoY growth 2022-2023 (%) | 20.02 |
| Regional analysis | North America, Europe, APAC, Middle East and Africa, and South America |
| Performing market contribution | North America at 33% |
| Key countries | US, China, Japan, Germany, and the UK |
| Competitive landscape | Leading Vendors, Market Positioning of Vendors, Competitive Strategies, and Industry Risks |
| Key companies profiled | ABB Ltd., Align Production Systems, HAHN Group GmbH, IAM Robotics, JASCI LLC, Koerber AG, L3Harris Technologies Inc., Lockheed Martin Corp., MIDEA Group, OMRON Corp., Robotnik Automation SLL, SESTO ROBOTICS Pte. Ltd., Stanley Robotics, Teradyne Inc., Thales, The Boeing Co., Vecna Robotics Inc., Zebra Technologies Corp., QinetiQ Ltd., and Toyota Motor Corp. |
| Market dynamics | Parent market analysis, market growth inducers and obstacles, fast-growing and slow-growing segment analysis, COVID-19 impact and recovery analysis and future consumer dynamics, and market condition analysis for the forecast period. |
| Customization purview | If our report has not included the data that you are looking for, you can reach out to our analysts and get segments customized. |
Table of contents:
1 Executive Summary
- 1.1 Market Overview
- Exhibit 01: Executive Summary – Chart on Market Overview
- Exhibit 02: Executive Summary – Data Table on Market Overview
- Exhibit 03: Executive Summary – Chart on Global Market Characteristics
- Exhibit 04: Executive Summary – Chart of Market by Geography
- Exhibit 05: Executive Summary – Chart on Market Segmentation by Product
- Exhibit 06: Executive Summary – Chart on Market Segmentation by Distribution Channel
- Exhibit 07: Executive Summary – Chart on Incremental Growth
- Exhibit 08: Executive Summary – Data Table on Incremental Growth
- Exhibit 09: Executive Summary – Chart on Vendor Market Positioning
2 Market Landscape
- 2.1 Market ecosystem
- Exhibit 10: Parent market
- Exhibit 11: Market Characteristics
3 Market Sizing
- 3.1 Market Definition
- Exhibit 12: Offerings of vendors included in the market definition
- 3.2 Market segment analysis
- Exhibit 13: Market segments
- 3.3 Market size 2022
- 3.4 Market outlook: Forecast for 2022-2027
- Exhibit 14: Chart on Global – Market size and forecast 2022-2027 ($ billion)
- Exhibit 15: Data Table on Global – Market size and forecast 2022-2027 ($ billion)
- Exhibit 16: Chart on Global Market: Year-over-year growth 2022-2027 (%)
- Exhibit 17: Data Table on Global Market: Year-over-year growth 2022-2027 (%)
4 Historic Market Size
- 4.1 Global kosher foods market 2017 – 2021
- Exhibit 18: Historic Market Size – Data Table on Global kosher foods market 2017 – 2021 ($ billion)
- 4.2 Product Segment Analysis 2017 – 2021
- Exhibit 19: Historic Market Size – Product Segment 2017 – 2021 ($ billion)
- 4.3 Distribution channel Segment Analysis 2017 – 2021
- Exhibit 20: Historic Market Size – Distribution channel Segment 2017 – 2021 ($ billion)
- 4.4 Geography Segment Analysis 2017 – 2021
- Exhibit 21: Historic Market Size – Geography Segment 2017 – 2021 ($ billion)
- 4.5 Country Segment Analysis 2017 – 2021
- Exhibit 22: Historic Market Size – Country Segment 2017 – 2021 ($ billion)
5 Five Forces Analysis
- 5.1 Five forces summary
- Exhibit 23: Five forces analysis – Comparison between 2022 and 2027
- 5.2 Bargaining power of buyers
- Exhibit 24: Chart on the Bargaining power of buyers – Impact of key factors 2022 and 2027
- 5.3 Bargaining power of suppliers
- Exhibit 25: Bargaining power of suppliers – Impact of key factors in 2022 and 2027
- 5.4 Threat of new entrants
- Exhibit 26: Threat of new entrants – Impact of key factors in 2022 and 2027
- 5.5 Threat of substitutes
- Exhibit 27: Threat of substitutes – Impact of key factors in 2022 and 2027
- 5.6 Threat of rivalry
- Exhibit 28: Threat of rivalry – Impact of key factors in 2022 and 2027
- 5.7 Market condition
- Exhibit 29: Chart on Market condition – Five forces 2022 and 2027
6 Market Segmentation by Product
- 6.1 Market segments
- Exhibit 30: Chart on Product – Market share 2022-2027 (%)
- Exhibit 31: Data Table on Product – Market share 2022-2027 (%)
- 6.2 Comparison by Product
- Exhibit 32: Chart of Comparison by Product
- Exhibit 33: Data Table on Comparison by Product
- 6.3 Kosher pareve – Market size and forecast 2022-2027
- Exhibit 34: Chart on Kosher pareve – Market size and forecast 2022-2027 ($ billion)
- Exhibit 35: Data Table on Kosher pareve – Market size and forecast 2022-2027 ($ billion)
- Exhibit 36: Chart on Kosher pareve – Year-over-year growth 2022-2027 (%)
- Exhibit 37: Data Table on Kosher pareve – Year-over-year growth 2022-2027 (%)
- 6.4 Kosher meat – Market size and forecast 2022-2027
- Exhibit 38: Chart on Kosher meat – Market size and forecast 2022-2027 ($ billion)
- Exhibit 39: Data Table on Kosher meat – Market size and forecast 2022-2027 ($ billion)
- Exhibit 40: Chart on Kosher meat – Year-over-year growth 2022-2027 (%)
- Exhibit 41: Data Table on Kosher meat – Year-over-year growth 2022-2027 (%)
- 6.5 Kosher dairy – Market size and forecast 2022-2027
- Exhibit 42: Chart on Kosher dairy – Market size and forecast 2022-2027 ($ billion)
- Exhibit 43: Data Table on Kosher dairy – Market size and forecast 2022-2027 ($ billion)
- Exhibit 44: Chart on Kosher dairy – Year-over-year growth 2022-2027 (%)
- Exhibit 45: Data Table on Kosher dairy – Year-over-year growth 2022-2027 (%)
- 6.6 Market opportunity by Product
- Exhibit 46: Market opportunity by Product ($ billion)
7 Market Segmentation by Distribution Channel
- 7.1 Market segments
- Exhibit 47: Chart on Distribution Channel – Market share 2022-2027 (%)
- Exhibit 48: Data Table on Distribution Channel – Market share 2022-2027 (%)
- 7.2 Comparison by Distribution Channel
- Exhibit 49: Chart of Comparison by Distribution Channel
- Exhibit 50: Data Table on Comparison by Distribution Channel
- 7.3 Supermarkets and hypermarkets – Market size and forecast 2022-2027
- Exhibit 51: Chart on Supermarkets and hypermarkets – Market size and forecast 2022-2027 ($ billion)
- Exhibit 52: Data Table on Supermarkets and hypermarkets – Market size and forecast 2022-2027 ($ billion)
- Exhibit 53: Chart on Supermarkets and hypermarkets – Year-over-year growth 2022-2027 (%)
- Exhibit 54: Data Table on Supermarkets and hypermarkets – Year-over-year growth 2022-2027 (%)
- 7.4 Grocery stores – Market size and forecast 2022-2027
- Exhibit 55: Chart on Grocery stores – Market size and forecast 2022-2027 ($ billion)
- Exhibit 56: Data Table on Grocery stores – Market size and forecast 2022-2027 ($ billion)
- Exhibit 57: Chart on Grocery stores – Year-over-year growth 2022-2027 (%)
- Exhibit 58: Data Table on Grocery stores – Year-over-year growth 2022-2027 (%)
- 7.5 Online stores – Market size and forecast 2022-2027
- Exhibit 59: Chart on Online stores – Market size and forecast 2022-2027 ($ billion)
- Exhibit 60: Data Table on Online stores – Market size and forecast 2022-2027 ($ billion)
- Exhibit 61: Chart on Online stores – Year-over-year growth 2022-2027 (%)
- Exhibit 62: Data Table on Online stores – Year-over-year growth 2022-2027 (%)
- 7.6 Market opportunity by Distribution Channel
- Exhibit 63: Market opportunity by Distribution Channel ($ billion)
8 Customer Landscape
- 8.1 Customer landscape overview
- Exhibit 64: Analysis of price sensitivity, lifecycle, customer purchase basket, adoption rates, and purchase criteria
9 Geographic Landscape
- 9.1 Geographic segmentation
- Exhibit 65: Chart of Market share by geography 2022-2027 (%)
- Exhibit 66: Data Table on Market share by geography 2022-2027 (%)
- 9.2 Geographic comparison
- Exhibit 67: Chart on Geographic comparison
- Exhibit 68: Data Table on Geographic comparison
- 9.3 North America – Market size and forecast 2022-2027
- Exhibit 69: Chart on North America – Market size and forecast 2022-2027 ($ billion)
- Exhibit 70: Data Table on North America – Market size and forecast 2022-2027 ($ billion)
- Exhibit 71: Chart on North America – Year-over-year growth 2022-2027 (%)
- Exhibit 72: Data Table on North America – Year-over-year growth 2022-2027 (%)
- 9.4 Europe – Market size and forecast 2022-2027
- Exhibit 73: Chart on Europe – Market size and forecast 2022-2027 ($ billion)
- Exhibit 74: Data Table on Europe – Market size and forecast 2022-2027 ($ billion)
- Exhibit 75: Chart on Europe – Year-over-year growth 2022-2027 (%)
- Exhibit 76: Data Table on Europe – Year-over-year growth 2022-2027 (%)
- 9.5 Middle East and Africa – Market size and forecast 2022-2027
- Exhibit 77: Chart on Middle East and Africa – Market size and forecast 2022-2027 ($ billion)
- Exhibit 78: Data Table on Middle East and Africa – Market size and forecast 2022-2027 ($ billion)
- Exhibit 79: Chart on Middle East and Africa – Year-over-year growth 2022-2027 (%)
- Exhibit 80: Data Table on Middle East and Africa – Year-over-year growth 2022-2027 (%)
- 9.6 South America – Market size and forecast 2022-2027
- Exhibit 81: Chart on South America – Market size and forecast 2022-2027 ($ billion)
- Exhibit 82: Data Table on South America – Market size and forecast 2022-2027 ($ billion)
- Exhibit 83: Chart on South America – Year-over-year growth 2022-2027 (%)
- Exhibit 84: Data Table on South America – Year-over-year growth 2022-2027 (%)
- 9.7 APAC – Market size and forecast 2022-2027
- Exhibit 85: Chart on APAC – Market size and forecast 2022-2027 ($ billion)
- Exhibit 86: Data Table on APAC – Market size and forecast 2022-2027 ($ billion)
- Exhibit 87: Chart on APAC – Year-over-year growth 2022-2027 (%)
- Exhibit 88: Data Table on APAC – Year-over-year growth 2022-2027 (%)
- 9.8 US – Market size and forecast 2022-2027
- Exhibit 89: Chart on US – Market size and forecast 2022-2027 ($ billion)
- Exhibit 90: Data Table on US – Market size and forecast 2022-2027 ($ billion)
- Exhibit 91: Chart on US – Year-over-year growth 2022-2027 (%)
- Exhibit 92: Data Table on US – Year-over-year growth 2022-2027 (%)
- 9.9 France – Market size and forecast 2022-2027
- Exhibit 93: Chart on France – Market size and forecast 2022-2027 ($ billion)
- Exhibit 94: Data Table on France – Market size and forecast 2022-2027 ($ billion)
- Exhibit 95: Chart on France – Year-over-year growth 2022-2027 (%)
- Exhibit 96: Data Table on France – Year-over-year growth 2022-2027 (%)
- 9.10 Israel – Market size and forecast 2022-2027
- Exhibit 97: Chart on Israel – Market size and forecast 2022-2027 ($ billion)
- Exhibit 98: Data Table on Israel – Market size and forecast 2022-2027 ($ billion)
- Exhibit 99: Chart on Israel – Year-over-year growth 2022-2027 (%)
- Exhibit 100: Data Table on Israel – Year-over-year growth 2022-2027 (%)
- 9.11 Canada – Market size and forecast 2022-2027
- Exhibit 101: Chart on Canada – Market size and forecast 2022-2027 ($ billion)
- Exhibit 102: Data Table on Canada – Market size and forecast 2022-2027 ($ billion)
- Exhibit 103: Chart on Canada – Year-over-year growth 2022-2027 (%)
- Exhibit 104: Data Table on Canada – Year-over-year growth 2022-2027 (%)
- 9.12 UK – Market size and forecast 2022-2027
- Exhibit 105: Chart on UK – Market size and forecast 2022-2027 ($ billion)
- Exhibit 106: Data Table on UK – Market size and forecast 2022-2027 ($ billion)
- Exhibit 107: Chart on UK – Year-over-year growth 2022-2027 (%)
- Exhibit 108: Data Table on UK – Year-over-year growth 2022-2027 (%)
- 9.13 Market opportunity by geography
- Exhibit 109: Market opportunity by geography ($ billion)
10 Drivers, Challenges, and Trends
- 10.1 Market drivers
- 10.2 Market challenges
- 10.3 Impact of drivers and challenges
- Exhibit 110: Impact of drivers and challenges in 2022 and 2027
- 10.4 Market trends
11 Vendor Landscape
- 11.1 Overview
- 11.2 Vendor landscape
- Exhibit 111: Overview of Criticality of inputs and Factors of differentiation
- 11.3 Landscape disruption
- Exhibit 112: Overview of factors of disruption
- 11.4 Industry risks
- Exhibit 113: Impact of key risks on business
12 Vendor Analysis
- 12.1 Vendors covered
- Exhibit 114: Vendors covered
- 12.2 Market positioning of vendors
- Exhibit 115: Matrix on vendor position and classification
- 12.3 AGRANA BEteilgungs AG
- Exhibit 116: AGRANA BEteilgungs AG – Overview
- Exhibit 117: AGRANA BEteilgungs AG – Business segments
- Exhibit 118: AGRANA BEteilgungs AG – Key offerings
- Exhibit 119: AGRANA BEteilgungs AG – Segment focus
- 12.4 Archer Daniels Midland Co.
- Exhibit 120: Archer Daniels Midland Co. – Overview
- Exhibit 121: Archer Daniels Midland Co. – Business segments
- Exhibit 122: Archer Daniels Midland Co. – Key offerings
- Exhibit 123: Archer Daniels Midland Co. – Segment focus
- 12.5 Aron Streit Inc.
- Exhibit 124: Aron Streit Inc. – Overview
- Exhibit 125: Aron Streit Inc. – Product / Service
- Exhibit 126: Aron Streit Inc. – Key offerings
- 12.6 BASF SE
- Exhibit 127: BASF SE – Overview
- Exhibit 128: BASF SE – Business segments
- Exhibit 129: BASF SE – Key news
- Exhibit 130: BASF SE – Key offerings
- Exhibit 131: BASF SE – Segment focus
- 12.7 Bobs Red Mill Natural Foods Inc.
- Exhibit 132: Bobs Red Mill Natural Foods Inc. – Overview
- Exhibit 133: Bobs Red Mill Natural Foods Inc. – Product / Service
- Exhibit 134: Bobs Red Mill Natural Foods Inc. – Key offerings
- 12.8 Conagra Brands Inc.
- Exhibit 135: Conagra Brands Inc. – Overview
- Exhibit 136: Conagra Brands Inc. – Business segments
- Exhibit 137: Conagra Brands Inc. – Key news
- Exhibit 138: Conagra Brands Inc. – Key offerings
- Exhibit 139: Conagra Brands Inc. – Segment focus
- 12.9 Empire Kosher Poultry LLC
- Exhibit 140: Empire Kosher Poultry LLC – Overview
- Exhibit 141: Empire Kosher Poultry LLC – Product / Service
- Exhibit 142: Empire Kosher Poultry LLC – Key offerings
- 12.10 General Mills Inc.
- Exhibit 143: General Mills Inc. – Overview
- Exhibit 144: General Mills Inc. – Business segments
- Exhibit 145: General Mills Inc. – Key news
- Exhibit 146: General Mills Inc. – Key offerings
- Exhibit 147: General Mills Inc. – Segment focus
- 12.11 Kayco Co.
- Exhibit 148: Kayco Co. – Overview
- Exhibit 149: Kayco Co. – Product / Service
- Exhibit 150: Kayco Co. – Key offerings
- 12.12 Kellogg Co.
- Exhibit 151: Kellogg Co. – Overview
- Exhibit 152: Kellogg Co. – Business segments
- Exhibit 153: Kellogg Co. – Key offerings
- Exhibit 154: Kellogg Co. – Segment focus
- 12.13 Nestle SA
- Exhibit 155: Nestle SA – Overview
- Exhibit 156: Nestle SA – Business segments
- Exhibit 157: Nestle SA – Key news
- Exhibit 158: Nestle SA – Key offerings
- Exhibit 159: Nestle SA – Segment focus
- 12.14 PepsiCo Inc.
- Exhibit 160: PepsiCo Inc. – Overview
- Exhibit 161: PepsiCo Inc. – Business segments
- Exhibit 162: PepsiCo Inc. – Key news
- Exhibit 163: PepsiCo Inc. – Key offerings
- Exhibit 164: PepsiCo Inc. – Segment focus
- 12.15 Taja Beverages
- Exhibit 165: Taja Beverages – Overview
- Exhibit 166: Taja Beverages – Product / Service
- Exhibit 167: Taja Beverages – Key offerings
- 12.16 The Kraft Heinz Co.
- Exhibit 168: The Kraft Heinz Co. – Overview
- Exhibit 169: The Kraft Heinz Co. – Business segments
- Exhibit 170: The Kraft Heinz Co. – Key offerings
- Exhibit 171: The Kraft Heinz Co. – Segment focus
- 12.17 Unilever PLC
- Exhibit 172: Unilever PLC – Overview
- Exhibit 173: Unilever PLC – Business segments
- Exhibit 174: Unilever PLC – Key news
- Exhibit 175: Unilever PLC – Key offerings
- Exhibit 176: Unilever PLC – Segment focus
13 Appendix
- 13.1 Scope of the report
- 13.2 Inclusions and exclusions checklist
- Exhibit 177: Inclusions checklist
- Exhibit 178: Exclusions checklist
- 13.3 Currency conversion rates for US$
- Exhibit 179: Currency conversion rates for US$
- 13.4 Research methodology
- Exhibit 180: Research methodology
- Exhibit 181: Validation techniques employed for market sizing
- Exhibit 182: Information sources
- 13.5 List of abbreviations
- Exhibit 183: List of abbreviations