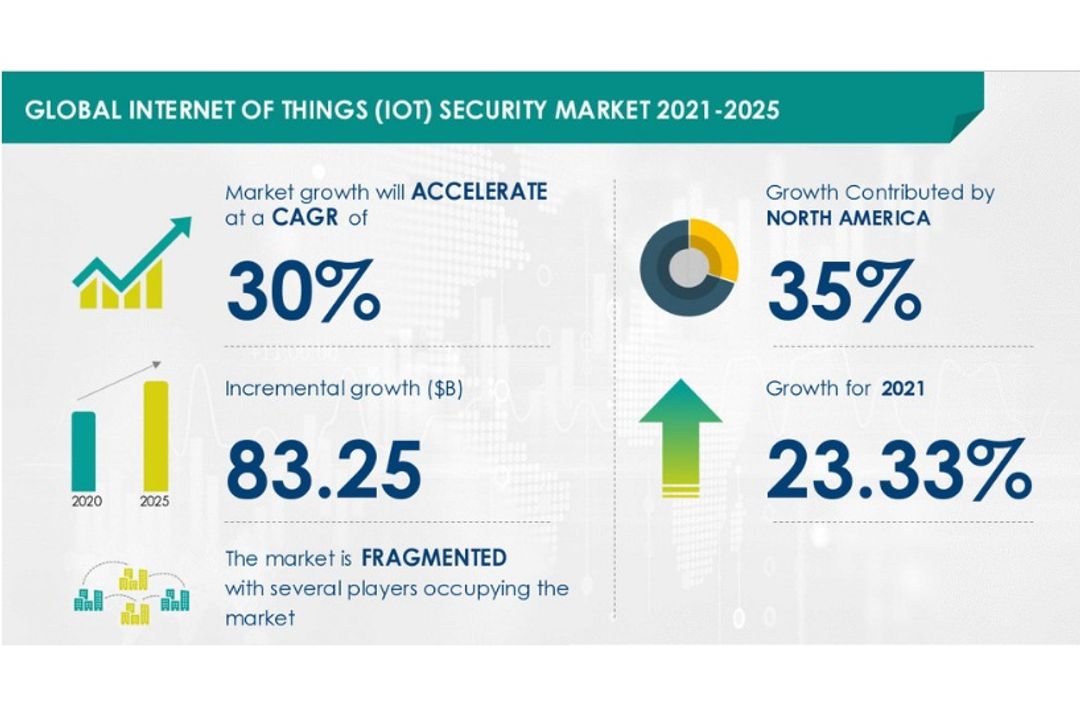
NEW YORK – According to the research report “Internet of Things Security Market by End-user and Geography – Forecast and Analysis”, the market witnessed a YOY growth of 23.33% at a CAGR of 30% during the forecast period. The report is segmented by end-user (industrial sector, commercial sector, and consumer sector) and geography (North America, Europe, APAC, MEA, and South America).
Vendor Insights
The global Internet of Things Security Market is fragmented and the vendors are deploying various organic and inorganic growth strategies to compete in the market.
The growing competition in the market is compelling vendors to adopt various growth strategies such as promotional activities and spending on advertisements to improve the visibility of their services. Some vendors are also adopting inorganic growth strategies such as M&As to remain competitive in the market.
The report analyzes the market’s competitive landscape and offers information on several market vendors, including:
- Allot Ltd.
- Broadcom Inc.
- CENTRI Technology Inc.
- Cisco Systems Inc.
- Fortinet Inc.
- Infineon Technologies AG
- Intel Corp.
- International Business Machines Corp.
- Mocana Corp.
- Thales Group
Find additional highlights on the growth strategies adopted by vendors and their product offerings.
Geographical Market Analysis
North America will account for 35% of market growth. In North America, the US is the main market for internet of things (IoT) security. Compared to other parts of Europe, this region’s market will increase more quickly.
The industrial, automotive, and healthcare industries are rapidly expanding in North America, and these industries have adopted IoT to increase operational efficiency and gain a competitive edge. Due to federal government attempts to lower healthcare costs and provide remote patient monitoring, the use of IoT in the healthcare sector is rising quickly in the US.
Furthermore, countries such as the US, China, Germany, South Korea (Republic of Korea), and UK are expected to emerge as prominent markets for the Internet of Things Security Market during the forecast period.
Know more about this market’s geographical distribution along with a detailed analysis of the top regions. Click here to get a sample report.
Key Segment Analysis
The industrial sector’s market share rose in the internet of things (IoT) security will be considerable. Due to the use of IoT in the manufacturing, automotive, energy, and telecommunications sectors, the segment is anticipated to rise strongly throughout the projected period. The requirement to protect vital data in these areas is one of the main factors influencing this increase.
View Sample: to know additional highlights and key points on various market segments and their impact in coming years.
Key Market Drivers & Challenges:
The rising frequency of cyberattacks is one of the main drivers boosting the internet of things (IoT) security market. The development of IoT in video surveillance is a significant driver fueling the growth of the internet of things (IoT) security market. However, one of the major issues impeding the internet of things (IoT) security market’s growth is the emergence of ransomware and DDoS attacks.
Get a Sample for highlights on market Drivers & Challenges affecting the Internet of Things Security Market.
Customize Your Report
Don’t miss out on the opportunity to speak to our analyst and know more insights about this market report. Our analysts can also help you customize this report according to your needs. Our analysts and industry experts will work directly with you to understand your requirements and provide you with customized data in a short amount of time.
| Internet of Things (IoT) Security Market Scope | |
| Report Coverage | Details |
| Page number | 120 |
| Base year | 2020 |
| Forecast period | 2021-2025 |
| Growth momentum & CAGR | Accelerate at a CAGR of 30% |
| Market growth 2021-2025 | $ 83.25 billion |
| Market structure | Fragmented |
| YoY growth (%) | 23.33 |
| Regional analysis | North America, Europe, APAC, MEA, and South America |
| Performing market contribution | North America at 35% |
| Key consumer countries | US, China, Germany, South Korea (Republic of Korea), and UK |
| Competitive landscape | Leading companies, Competitive strategies, Consumer engagement scope |
| Key companies profiled | Allot Ltd., Broadcom Inc., CENTRI Technology Inc., Cisco Systems Inc., Fortinet Inc., Infineon Technologies AG, Intel Corp., International Business Machines Corp., Mocana Corp., and Thales Group |
| Market dynamics | Parent market analysis, Market growth inducers and obstacles, Fast-growing and slow-growing segment analysis, COVID 19 impact and recovery analysis and future consumer dynamics, Market condition analysis for forecast period |
| Customization purview | If our report has not included the data that you are looking for, you can reach out to our analysts and get segments customized. |
Table of Contents
1 Executive Summary
2 Market Landscape
- 2.1 Market ecosystem
- Exhibit 01: Parent market
- 2.2 Market characteristics
- Exhibit 02: Market characteristics
- 2.3 Value chain analysis
- Exhibit 03: Value chain analysis: global systems software market
3 Market Sizing
- 3.1 Market definition
- Exhibit 04: Offerings of vendors included in the market definition
- 3.2 Market segment analysis
- Exhibit 05: Market segments
- 3.3 Market size 2021
- 3.4 Market outlook: Forecast for 2021 – 2025
- Exhibit 06: Global – Market size and forecast 2021 – 2025 ($ billion)
- Exhibit 07: Global market: Year-over-year growth 2021 – 2025 (%)
4 Five Forces Analysis
- 4.1 Five forces summary
- Exhibit 08: Five forces analysis 2021 & 2025
- 4.2 Bargaining power of buyers
- Exhibit 09: Bargaining power of buyers
- 4.3 Bargaining power of suppliers
- Exhibit 10: Bargaining power of suppliers
- 4.4 Threat of new entrants
- Exhibit 11: Threat of new entrants
- 4.5 Threat of substitutes
- Exhibit 12: Threat of substitutes
- 4.6 Threat of rivalry
- Exhibit 13: Threat of rivalry
- 4.7 Market condition
- Exhibit 14: Market condition – Five forces 2021
5 Market Segmentation by End-user
- 5.1 Market segments
- Exhibit 15: End user – Market share 2021-2025 (%)
- 5.2 Comparison by End user
- Exhibit 16: Comparison by End user
- 5.3 Industrial sector – Market size and forecast 2021-2025
- Exhibit 17: Industrial sector – Market size and forecast 2021-2025 ($ billion)
- Exhibit 18: Industrial sector – Year-over-year growth 2021-2025 (%)
- 5.4 Commercial sector – Market size and forecast 2021-2025
- Exhibit 19: Commercial sector – Market size and forecast 2021-2025 ($ billion)
- Exhibit 20: Commercial sector – Year-over-year growth 2021-2025 (%)
- 5.5 Consumer sector – Market size and forecast 2021-2025
- Exhibit 21: Consumer sector – Market size and forecast 2021-2025 ($ billion)
- Exhibit 22: Consumer sector – Year-over-year growth 2021-2025 (%)
- 5.6 Market opportunity by End user
- Exhibit 23: Market opportunity by End user
6 Customer landscape
7 Geographic Landscape
- 7.1 Geographic segmentation
- Exhibit 25: Market share by geography 2021-2025 (%)
- 7.2 Geographic comparison
- Exhibit 26: Geographic comparison
- 7.3 North America – Market size and forecast 2021-2025
- Exhibit 27: North America – Market size and forecast 2021-2025 ($ billion)
- Exhibit 28: North America – Year-over-year growth 2021-2025 (%)
- 7.4 Europe – Market size and forecast 2021-2025
- Exhibit 29: Europe – Market size and forecast 2021-2025 ($ billion)
- Exhibit 30: Europe – Year-over-year growth 2021-2025 (%)
- 7.5 APAC – Market size and forecast 2021-2025
- Exhibit 31: APAC – Market size and forecast 2021-2025 ($ billion)
- Exhibit 32: APAC – Year-over-year growth 2021-2025 (%)
- 7.6 MEA – Market size and forecast 2021-2025
- Exhibit 33: MEA – Market size and forecast 2021-2025 ($ billion)
- Exhibit 34: MEA – Year-over-year growth 2021-2025 (%)
- 7.7 South America – Market size and forecast 2021-2025
- Exhibit 35: South America – Market size and forecast 2021-2025 ($ billion)
- Exhibit 36: South America – Year-over-year growth 2021-2025 (%)
- 7.8 Key leading countries
- Exhibit 37: Key leading countries
- 7.9 Market opportunity by geography
- Exhibit 38: Market opportunity by geography ($ billion)
8 Drivers, Challenges, and Trends
- 8.1 Market drivers
- 8.2 Market challenges
- 8.3 Market trends
9 Vendor Landscape
- 9.1 Overview
- Exhibit 40: Vendor landscape
- 9.2 Competitive scenario
- 9.3 Landscape disruption
- Exhibit 41: Landscape disruption
- Exhibit 42: Industry risks
10 Vendor Analysis
- 10.1 Vendors covered
- Exhibit 43: Vendors covered
- 10.2 Market positioning of vendors
- Exhibit 44: Market positioning of vendors
- 10.3 Allot Ltd.
- Exhibit 45: Allot Ltd. – Overview
- Exhibit 46: Allot Ltd. – Business segments
- Exhibit 47: Allot Ltd. – Key news
- Exhibit 48: Allot Ltd. – Key offerings
- 10.4 Broadcom Inc.
- Exhibit 49: Broadcom Inc. – Overview
- Exhibit 50: Broadcom Inc. – Business segments
- Exhibit 51: Broadcom Inc. – Key news
- Exhibit 52: Broadcom Inc. – Key offerings
- Exhibit 53: Broadcom Inc. – Segment focus
- 10.5 CENTRI Technology Inc.
- Exhibit 54: CENTRI Technology Inc. – Overview
- Exhibit 55: CENTRI Technology Inc. – Product and service
- Exhibit 56: CENTRI Technology Inc. – Key news
- Exhibit 57: CENTRI Technology Inc. – Key offerings
- 10.6 Cisco Systems Inc.
- Exhibit 58: Cisco Systems Inc. – Overview
- Exhibit 59: Cisco Systems Inc. – Business segments
- Exhibit 60: Cisco Systems Inc. – Key news
- Exhibit 61: Cisco Systems Inc. – Key offerings
- Exhibit 62: Cisco Systems Inc. – Segment focus
- 10.7 Fortinet Inc.
- Exhibit 63: Fortinet Inc. – Overview
- Exhibit 64: Fortinet Inc. – Business segments
- Exhibit 65: Fortinet Inc. – Key news
- Exhibit 66: Fortinet Inc. – Key offerings
- 10.8 Infineon Technologies AG
- Exhibit 67: Infineon Technologies AG – Overview
- Exhibit 68: Infineon Technologies AG – Business segments
- Exhibit 69: Infineon Technologies AG – Key news
- Exhibit 70: Infineon Technologies AG – Key offerings
- Exhibit 71: Infineon Technologies AG – Segment focus
- 10.9 Intel Corp.
- Exhibit 72: Intel Corp. – Overview
- Exhibit 73: Intel Corp. – Business segments
- Exhibit 74: Intel Corp. – Key news
- Exhibit 75: Intel Corp. – Key offerings
- Exhibit 76: Intel Corp. – Segment focus
- 10.10 International Business Machines Corp.
- Exhibit 77: International Business Machines Corp. – Overview
- Exhibit 78: International Business Machines Corp. – Business segments
- Exhibit 79: International Business Machines Corp. – Key news
- Exhibit 80: International Business Machines Corp. – Key offerings
- Exhibit 81: International Business Machines Corp. – Segment focus
- 10.11 Mocana Corp.
- Exhibit 82: Mocana Corp. – Overview
- Exhibit 83: Mocana Corp. – Product and service
- Exhibit 84: Mocana Corp. – Key news
- Exhibit 85: Mocana Corp. – Key offerings
- 10.12 Thales Group
- Exhibit 86: Thales Group – Overview
- Exhibit 87: Thales Group – Business segments
- Exhibit 88: Thales Group – Key news
- Exhibit 89: Thales Group – Key offerings
- Exhibit 90: Thales Group – Segment focus
11 Appendix
- 11.1 Scope of the report
- 11.2 Currency conversion rates for US$
- Exhibit 91: Currency conversion rates for US$
- 11.3 Research methodology
- Exhibit 92: Research Methodology
- Exhibit 93: Validation techniques employed for market sizing
- Exhibit 94: Information sources
- 11.4 List of abbreviations
- Exhibit 95: List of abbreviations